Payer Rate Transparency and What It Means for Your Clinic's Strategy
How ABA operators can leverage payer rate data to make confident expansion decisions and negotiate better contracts.
7 min read
The Challenge of Limited Information
To date, ABA operators have made expansion and contracting decisions with limited information. Clinics negotiated largely in isolation, relying on peer anecdotes, general benchmarks, or past experience.
If you suspected your rates were below market, there was no straightforward way to confirm it. And when evaluating a new market, you might know that demand is strong. You might know a payer has meaningful share and there is patient demand, but the question remains:
Will this market actually support sustainable care delivery at scale?
Not all markets are created equal and strong reimbursement rates alone don't guarantee a market is ready for growth. Even with top-quartile rates, the real constraints are often elsewhere: too few credentialed providers to staff a clinic, a child population too thin to sustain caseload, or a zip code where demand simply hasn't materialized. Knowing your rates are competitive is a starting point, not a full answer.
Camber's Payer Rates Data tool combines four data sources - BACB provider data, Medicaid requirements, Census population data, and payer-reported rates - into a single view. Together, they give operators a complete picture of whether a market can actually support sustainable growth, not just whether the rates look good on paper.
Why Payer-Reported Rates Matter More Than Ever
Transparency Coverage Act Is Changing the Game
The Transparency in Coverage (TiC) Rule has created unprecedented access to payer pricing data. The raw files payers are required to publish are massive, take days and often weeks to download, and are difficult to parse, but the implication is significant: for the first time, it's possible to see the ranges of rates that payers are reimbursing.
But what clinics need from that data isn't the raw files - it's clear, usable intelligence that is:
Simple to search and understand
Data that's accessible without specialized technical skills.
Easy to compare across counties and payers
Side-by-side views for strategic planning.
Relevant data useful for planning expansion or negotiating contracts
Actionable insights for real business decisions.
Camber takes these complicated files and turns them into straightforward, readily usable data.
Rising Demand, Rising Costs, Flat Rates
Running an ABA clinic today is harder than it was five years ago, even one year ago. More children need autism services. Staffing and operational costs are rising. Regulation is changing. And many payers are holding reimbursement rates flat, or quietly changing them.
In this environment, growth decisions carry more risk. Opening in the wrong geography or signing unfavorable payer contracts can squeeze margins before your clinic even reaches full capacity. The cost of a poor market entry isn't just financial as it also impacts the families waiting for care at clinics that are struggling to stay staffed.
How Clinics Research Payer-Reported Rates Today (and Why It Falls Short)
Today, many ABA clinics still piece together payer rate information using a mix of anecdotal feedback from peers, analyzing historical claims from their own clinic, or simply relying on intuition. While these methods can offer some insight, they are slow, fragmented, and often incomplete.
The deeper problem is that these methods rarely answer the questions that actually drive expansion decisions, and assembling the searching for those answers requires significant manual effort.
Which counties genuinely offer higher reimbursement for technician-delivered services?
Where is a specific payer-reported over- or under-paying relative to the rest of the market?
How does rate variability across geographies affect where to open next?
The data exists to answer these questions. It just hasn't been accessible in a form that's fast enough to be useful.
Introducing Camber's Payer-Reported Rates Data Tool
Camber's Payer Rates Data tool provides ABA operators a single view of payer rate intelligence, designed for expansion planning, network strategy, and benchmarking for contract negotiation (Note: the data is payer-reported and may not always be fully accurate). All data is fully exportable for deeper analysis or easy import into your internal systems.
Rather than static spreadsheets or anecdotal benchmarks, the tool offers:
Interactive maps
Visualize rate variation across geographies at a glance.
State- and county-level rate visibility
Compare markets to identify high-value opportunities.
Payer-specific benchmarking
See how each payer performs relative to others to guide network strategy.
CPT-specific filtering
Focus on the services that drive your clinic's revenue.
Distribution and quartile analysis
Understand where rates for a county sits relative to others and plan accordingly.
The tool also includes staffing and population context that matters for market entry decisions: the number of certified BCBAs and RBTs in a market (to anticipate staffing competition and supervisory capacity) and census data on the population under 18 (to assess whether a pediatric patient base is large enough to support a new clinic).
Using the Tool for a Texas Expansion Decision
Scenario
You operate a clinic in Texas and are evaluating a second location. Blue Cross Blue Shield of Texas has significant market share in the state, and you want to understand where technician-delivered services are reimbursed most favorably before committing to a site.
Step 1: Filter by Payer
Set the payer filter to Blue Cross and Blue Shield of Texas. This immediately narrows the view to rates that matter most to your revenue mix.
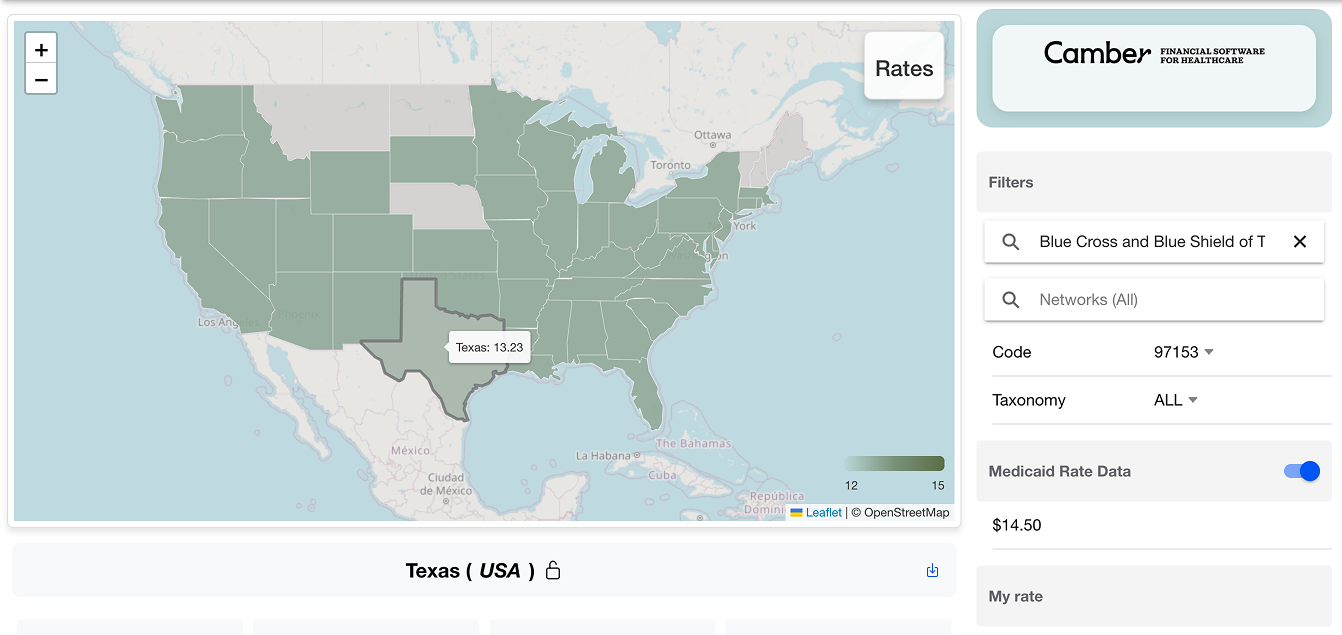
Step 2: Filter by CPT Code
Select CPT 97153 - Adaptive Behavior Treatment by Protocol.
This is the most commonly billed ongoing ABA service and the backbone of clinic revenue. Rate variation here has the most direct impact on viability.
Step 3: Explore the Map
Zoom into Texas and begin scanning county-level rate variation based on the color gradient scale.
One county stands out immediately: Floyd County is noticeably darker than its neighbors, indicating meaningfully higher reimbursement rates.
Step 4: Validate with Distribution Data
Scroll down to the quartile distribution chart.
You can quickly confirm that:
Floyd County sits in the top reimbursement quartile. Its average BCBS Texas 97153 reimbursement rate is meaningfully higher than most Texas counties.
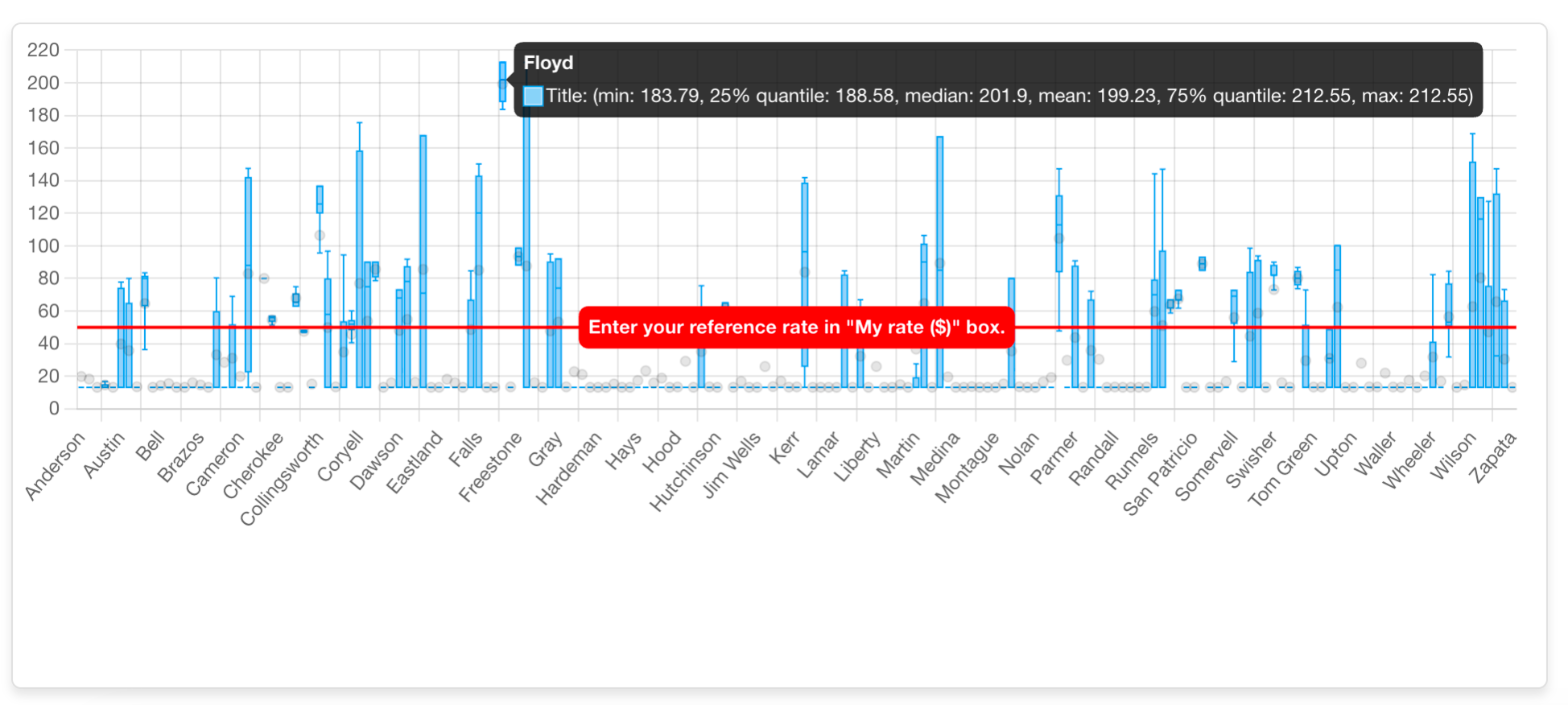
This isn't anecdotal. It's visible, benchmarked, and defensible.
Want to see this exact workflow in action? See our demo walkthrough of the Payer Rates Data tool.
See the Tool in ActionStrategic Questions the Tool Helps Answer
The Texas example is one application. The tool supports a much broader set of strategic decisions across expansion, network strategy, and contract negotiation.
Expansion Strategy
Which states and counties support stronger unit economics?
Where can new clinics ramp faster without margin pressure?
How does payer-reported rate variability affect site selection?
Payer Network Strategy
Which payers are worth prioritizing in each geography?
Where does one payer meaningfully outperform others?
Commercial payer-reported rates don't tell the complete story. Paired with Medicaid requirements data, RBT requirements, telehealth allowances, concurrent billing rules, EVV requirements, operators get a more complete picture of revenue potential and operational feasibility in a given market. With policies changing rapidly, the data is constantly updated to provide operators with the latest information.
The Data Is Within Reach
ABA expansion is no longer constrained by demand. It's constrained by the ability to make confident, data-driven decisions before capital is deployed, teams are hired, and families are waiting for care.
Operators who rely on intuition, outdated benchmarks, or fragmented payer insights risk opening clinics that look viable on paper but struggle in reality. In a market defined by rising costs, tighter reimbursement, and increasing regulatory complexity, guesswork is expensive.
Camber's Payer Rates Data tool gives operators something the industry has long lacked: clarity. Clarity on where revenue potential actually exists. Clarity on which payers are worth prioritizing. Clarity on how to negotiate, expand, and scale with confidence.
The clinics that win over the next decade won't be the ones that grow fastest. They'll be the ones that grow intentionally, with data that aligns clinical care, operations, and financial reality.
Camber is built to support that kind of growth.
Access the Tool Today
Ready to make smarter expansion decisions? Explore payer rate data across states, counties, and CPT codes to find your next high-value market.
We'd love to hear your ideas! If there are ways to improve the tool or new features and data that would help clinics like yours, get in touch at joel@camber.health.
You may also like
The Referral Relationship Playbook for ABA Practices
Build and maintain strong referral relationships to grow your ABA practice sustainably.
Read the playbookCase StudyCentralReach to Paid: A Single Claim's Journey Through Camber
Follow a claim from submission to payment and see how Camber automates the revenue cycle.
Read the case study