
The Practice That Lasts: What the Claims Data Tells Us
A fuller picture of what ABA practices earn, collect, and spend to get paid, combining Camber's claims data with Flychain's financial benchmarks.
8 min read
We looked for the biggest source of leakage
There's more to the financial health of an ABA practice than any single metric. That's why we partnered with Flychain to look at the numbers from a few different angles, combining Camber's claims data with Flychain's financial benchmarks to get a more complete picture of what practices earn, collect, and spend to get paid.
In our analysis, we found an often-overlooked source of revenue leakage: claims requiring rework.
Roughly 28% of claims on our platform go through that cycle. Almost a third of receivables require additional work before they're collected, without ever showing up as a denial. Camber's data gives us a clear view into what happens to a claim on its way to payment, but there's another part of the equation: what the practice ultimately collects once that money comes in. Flychain's benchmarks help us understand that side of the picture.
The three things actually breaking claims
Once we isolated the 28% of claims going through rework, we wanted to understand what was causing it. We looked at the reasons behind those claims across the platform, and the biggest drivers were surprisingly straightforward.
The three biggest drivers were documentation and information gaps, coverage issues, and credentialing. Documentation and information gaps were the largest, accounting for close to 20% of denied dollars. Missing or changing coverage details can stop a claim from moving forward, while enrollment and provider credentialing issues can interrupt otherwise valid claims.
Share of denied dollars by denial family
| Denial family | Share |
|---|---|
| Information and documentation | ~19% |
| Coverage and coordination | ~13% |
| Credentialing | ~10% |
| Timely filing | ~7% |
| Coding and modifier | ~6% |
| Authorization | ~5% |
What this means: The issues are largely administrative, so the opportunity is to improve the systems and processes around intake and billing rather than change how care is delivered or add more clinical documentation training.
Every practice can close this gap, it just takes consistency
We also saw first-try claim success improve over time. Across clinics on our platform, it goes from 77% to 92% over the first two years. We measured every practice over the same two-year period, so the differences by practice size aren't coming from comparing different timeframes.
A large share of the improvement appears to have come from larger practices. Enterprise clinics saw an average 31-point increase over two years, while midmarket and SMB practices also improved, though to a lesser extent. Their higher starting baseline may have left less room for additional improvement.
For larger practices, consistency seems to be a big part of the story. With multiple locations and teams, it's common for each one to develop its own way of handling claims: different documentation habits, different shortcuts, different interpretations of the same payer rules. Getting everyone onto the same process is harder when you have multiple teams and locations, but it also creates more room for improvement. That's likely why Enterprise clinics see the steepest gains: standardizing across locations takes time, but there's simply more ground to cover when teams start from different processes.
Once practices get to a consistent process, size matters less. Ongoing rework rates are fairly similar across Enterprise, Midmarket, and SMB practices. The biggest difference is how much room there was to improve in the first place, rather than how clean claims are once a consistent process is in place.
The same insurer pays twice as much depending on the state.
The value of that claim was fixed earlier, in a contract most owners have never benchmarked. Geography adds another layer of variation, with the same insurer reimbursing identical ABA services at different rates depending on the state.
The gap between the highest and lowest reimbursement for an identical ABA service, across four major insurers.
Rates get decided long before a claim exists
Everything we've looked at so far happens after a claim is submitted. Reimbursement rates are set much earlier, when a practice negotiates with a payer.
Flychain pulled published Transparency in Coverage rates for UnitedHealthcare-family plans across 216 ABA provider organizations in Kansas, Oklahoma, and Missouri, covering more than 3,400 individual rate filings. Within the same payer, region, and credential modifier, they found a 47% difference between the lowest and highest rate paid for the same code.
The difference wasn't explained by geography or acuity. In this sample, about 64% of practices were at the payer's default floor rate. For CPT 97153, which typically makes up the largest share of billed units for an ABA practice, the floor was $14.18 per 15-minute unit, compared with $20.90 at the top. The median rate was right at the floor.
At $6.72 more per unit, the difference gets meaningful pretty quickly. For a clinician billing 97153 consistently, it can amount to tens of thousands of dollars a year. Across a larger team, the difference can be six figures. So even a practice with a well-run billing operation can still fall below its potential if the underlying reimbursement rate was never negotiated above the floor.
What a bounced claim actually costs
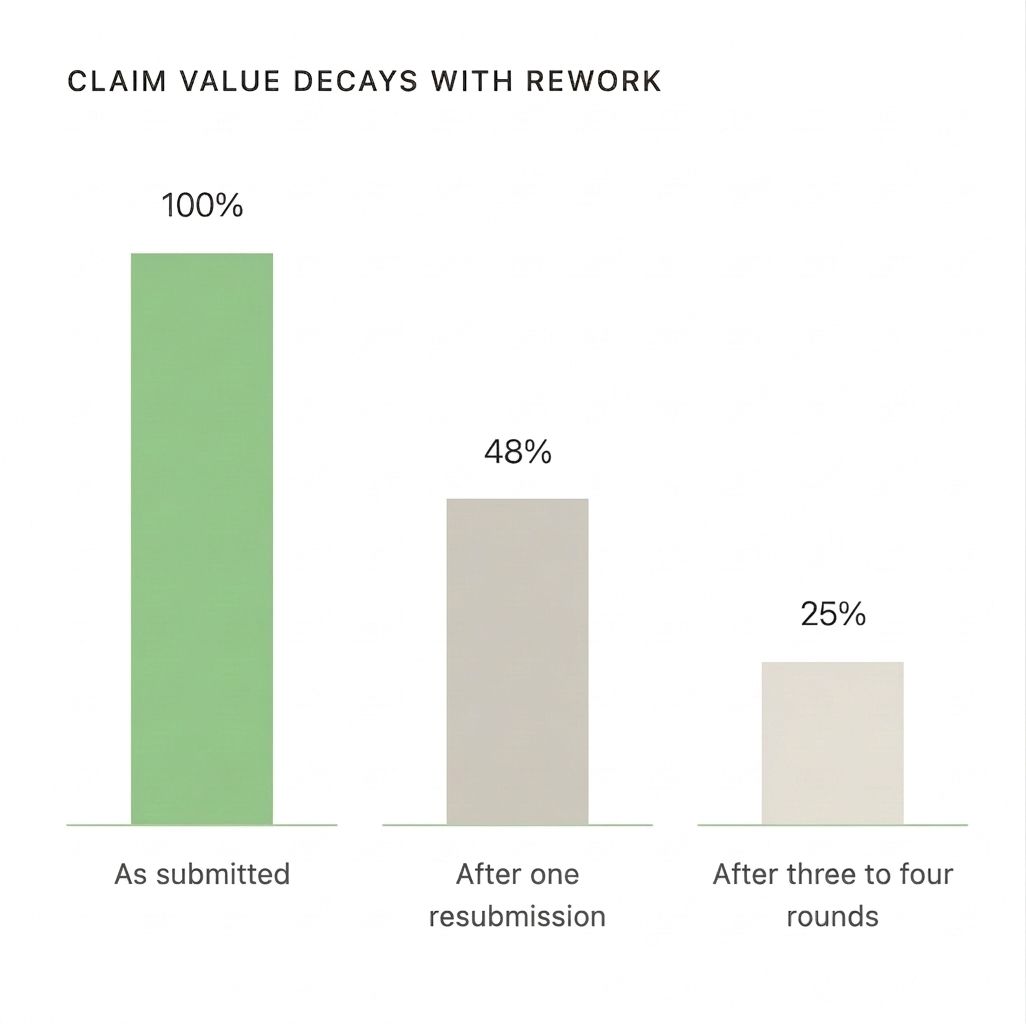
A claim that gets kicked back not only takes longer to pay but often ends up being worth less. One round of rework and a practice is looking at roughly 48% of that value. Three or four rounds in, that number is closer to 25%, and it's arriving months after the appointment happened.
We wanted to know what that actually costs in staff time, so we checked it against the CAQH Index, which tracks manual versus electronic costs for standard healthcare administrative transactions. Lining that up against the transaction types a reworked claim actually touches, eligibility and benefits checks run $12.95 manually against $2.04 electronic, while prior authorization, claim submission, and remittance advice all show similar multiples. A reworked claim can require several of these transactions, sometimes more than once.
There's no separate line item for this work. It's usually part of administrative headcount, which makes up 18% of operating revenue or less in Flychain's benchmark data. With 28% of claims requiring additional work before they're paid, some of that administrative spend is directly tied to getting claims through the billing process.
Where this leaves a practice
A lot of the factors that affect revenue in this report won't show up in a standard denial rate report. The 28% rework rate, the payers with much higher rework, and the differences in reimbursement from one state to another all sit outside that one metric.
Looking beyond denial rate gives a much better view of where revenue can get held up or lost. Claims can go through multiple rounds of rework before they're paid, reimbursement rates can vary widely, and some payer mixes create more friction than others. Together, those factors can have a meaningful impact on how much revenue a practice actually collects.