Camber

Explore ABA reimbursement rates by state and county

Gain a clear view of payer rates across different markets to help with expansion planning, rate comparisons, and contract negotiations.

Enter your email to receive your access code

Note: Data is self-reported by payers and may not always be fully accurate.
How to use Camber's Payer Rate Data Tool

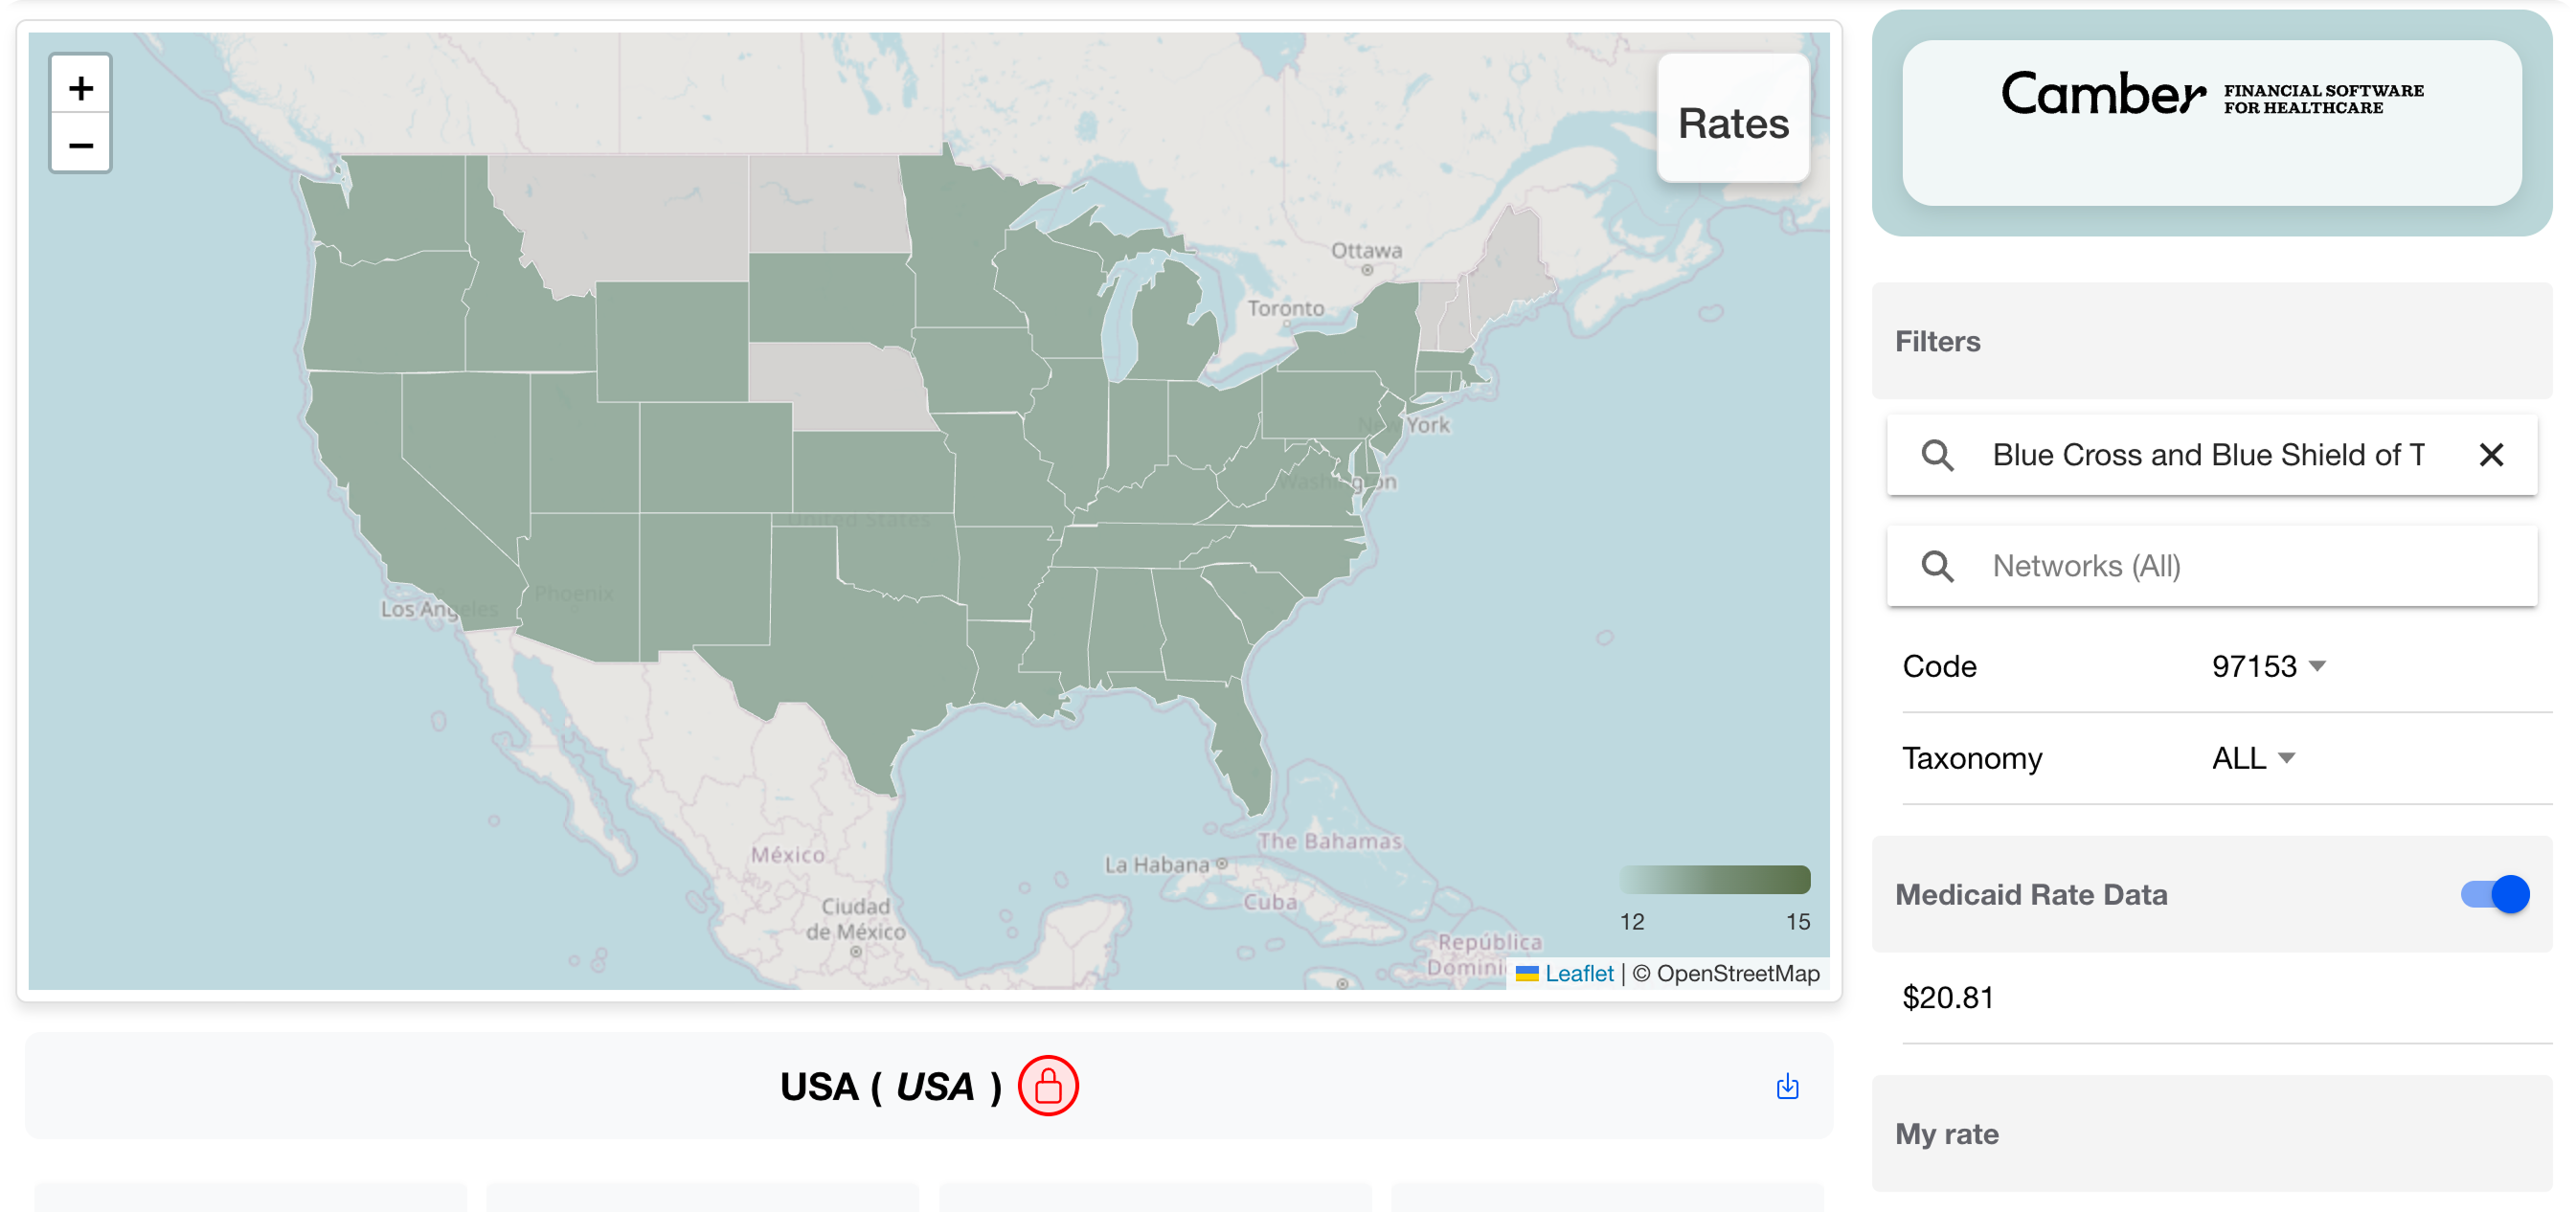
National-level payer rates map filtered to Blue Cross and Blue Shield, CPT code 97153
Type the name of the payer you're looking for or select it from the drop-down.
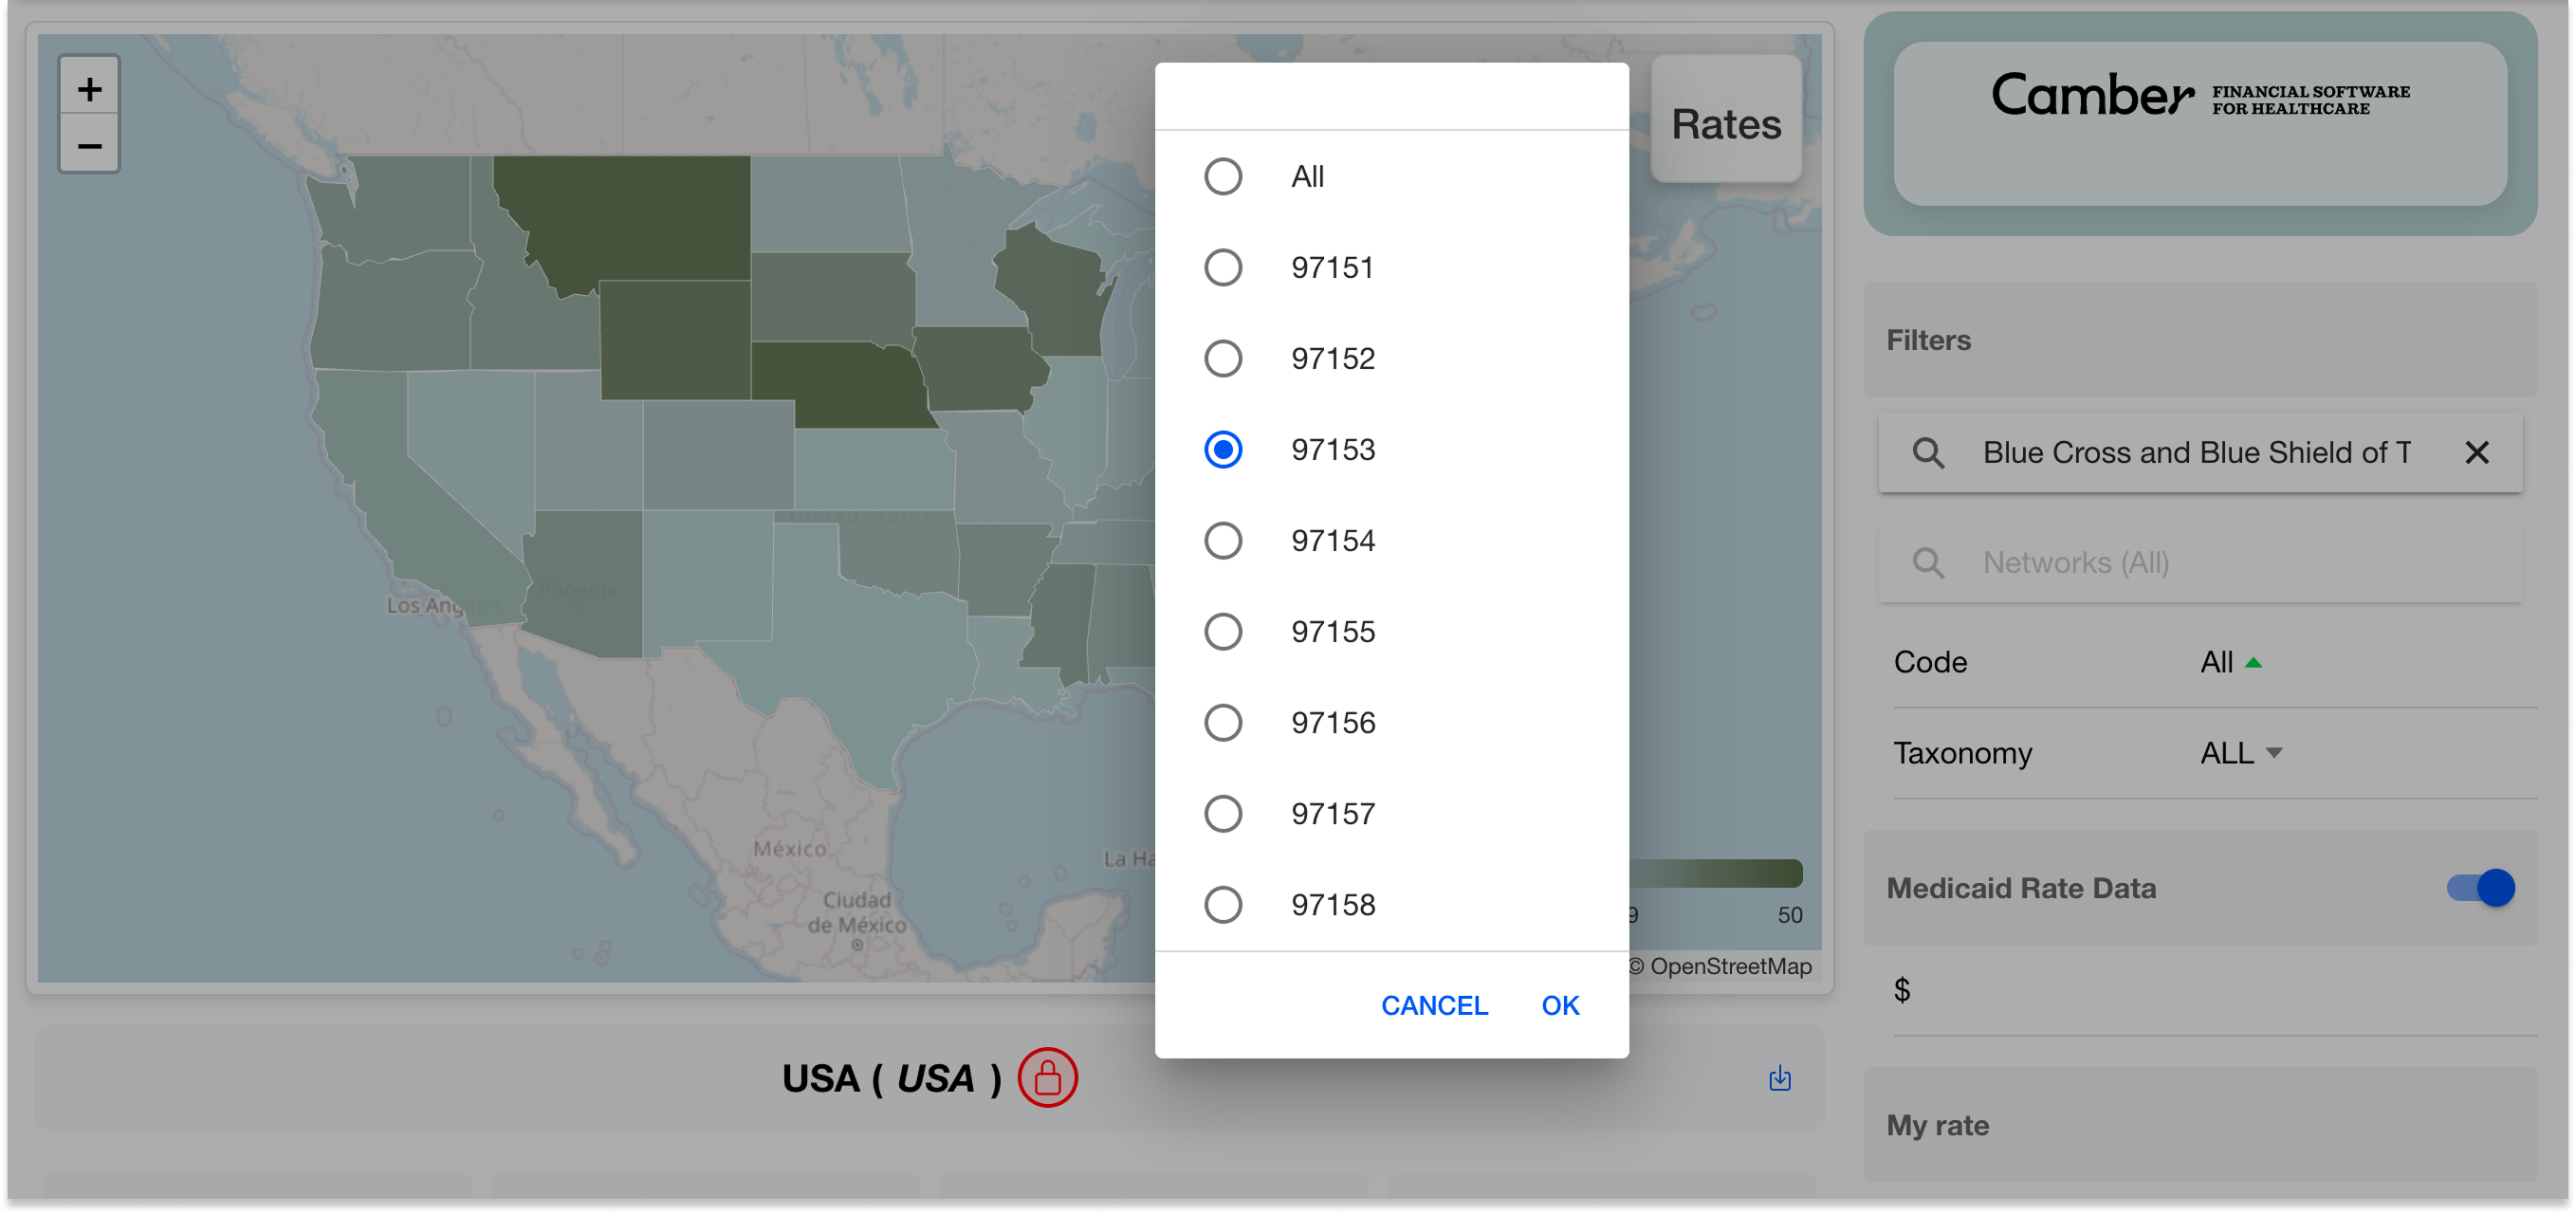
CPT code selector dropdown showing ABA codes 97151 through 97158
Next, we can refine our search by CPT code. Let's focus on 97153 (Adaptive Behavior Treatment by Protocol), the most frequently billed ongoing ABA service.
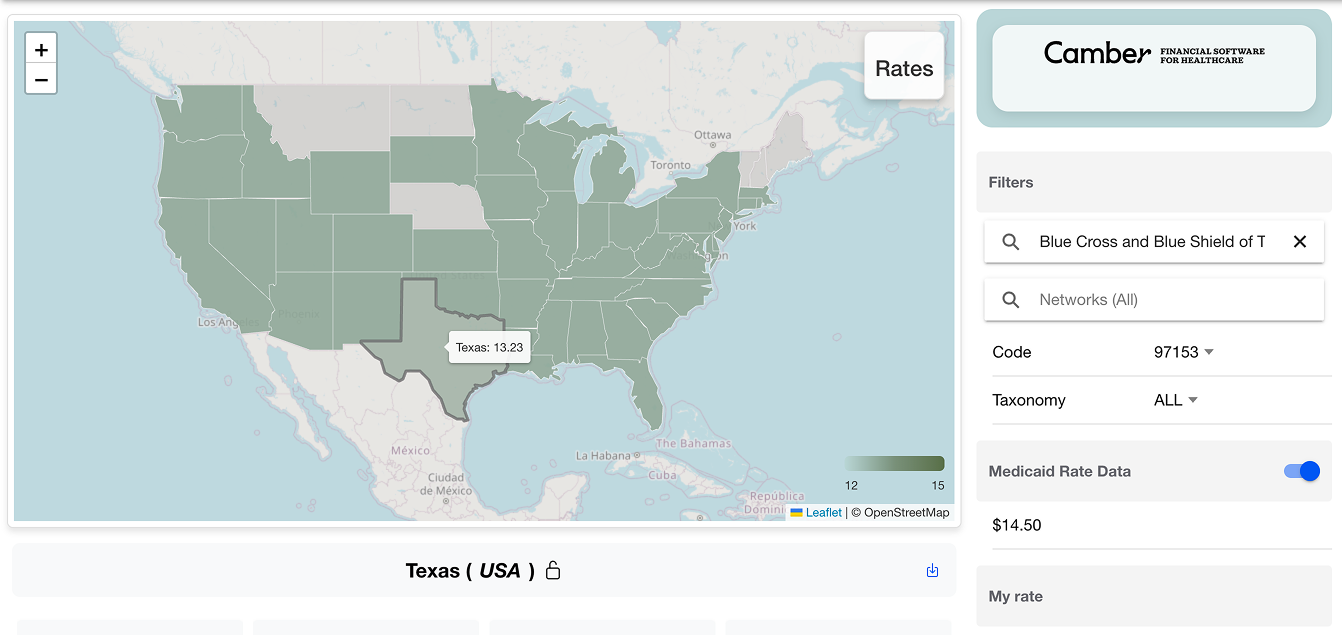
Map zoomed into Texas showing a $14.50 average rate tooltip for CPT code 97153
Now, let's zoom in on Texas by double-clicking into the state.
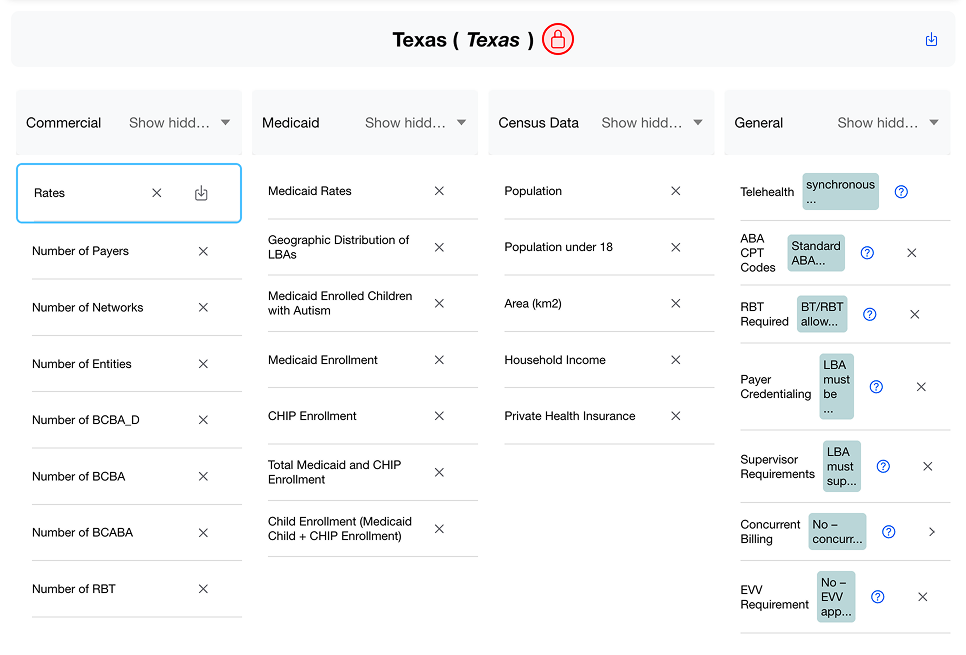
Texas data table showing Commercial, Medicaid, Census Data, and General metrics
As you scroll down, you'll see Texas' state Medicaid requirements. Hover over any item for more details.
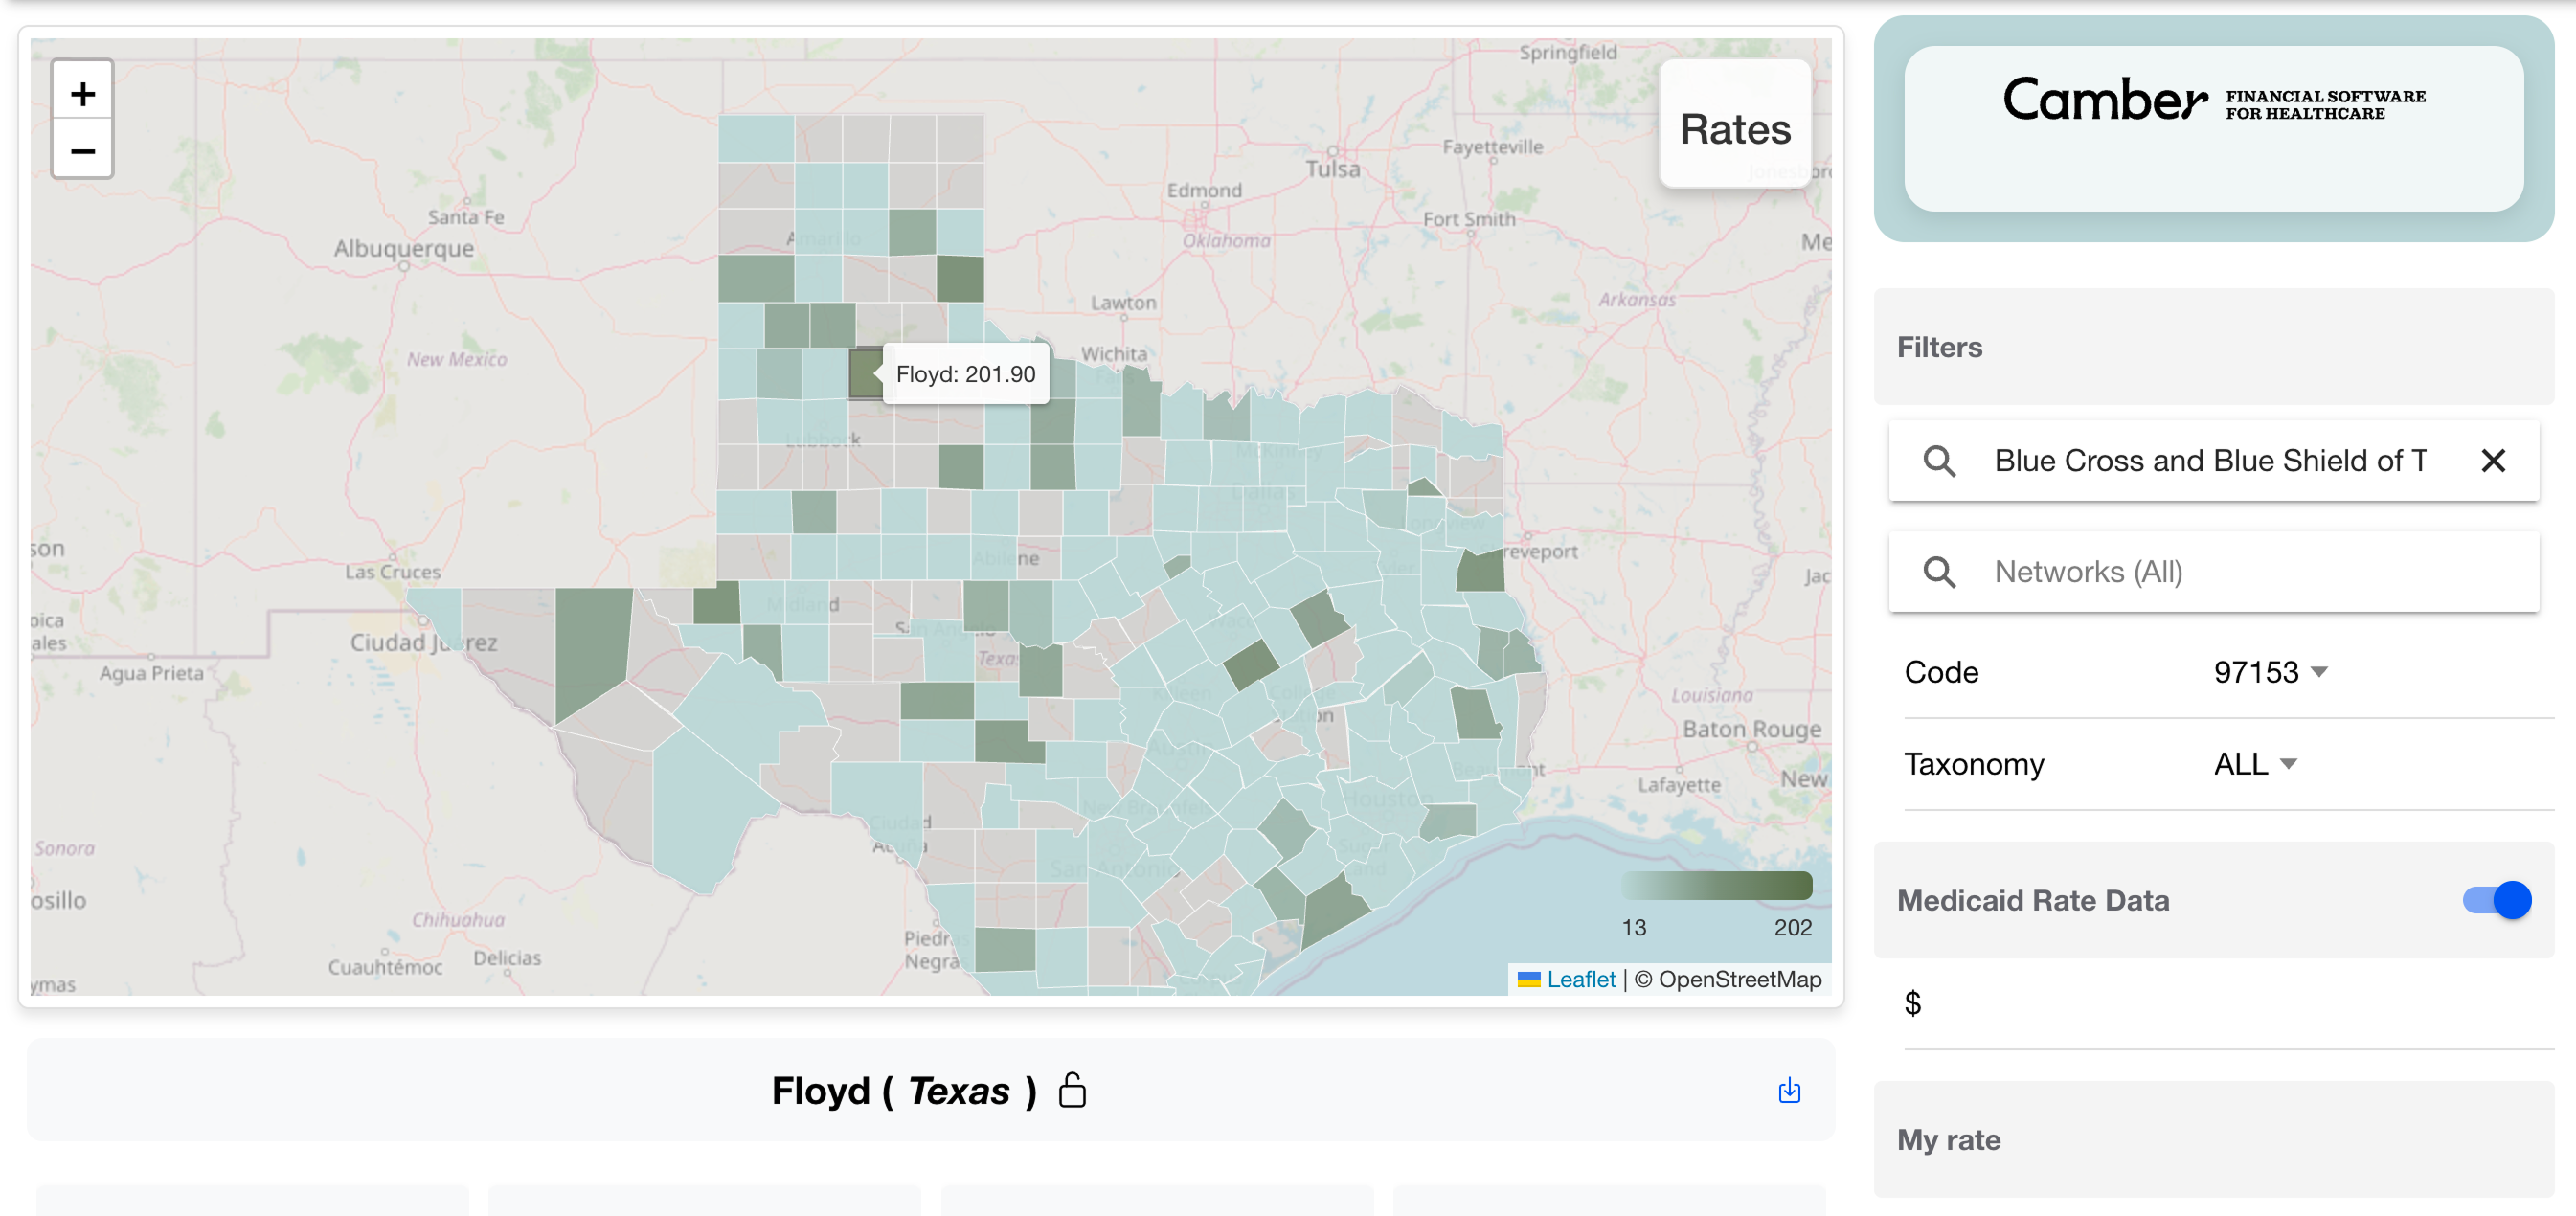
County-level map of Texas zoomed into Floyd County showing a $201.90 rate
Looking at the Texas rates heatmap, Floyd County stands out with higher rates. Let's double-click to explore further.
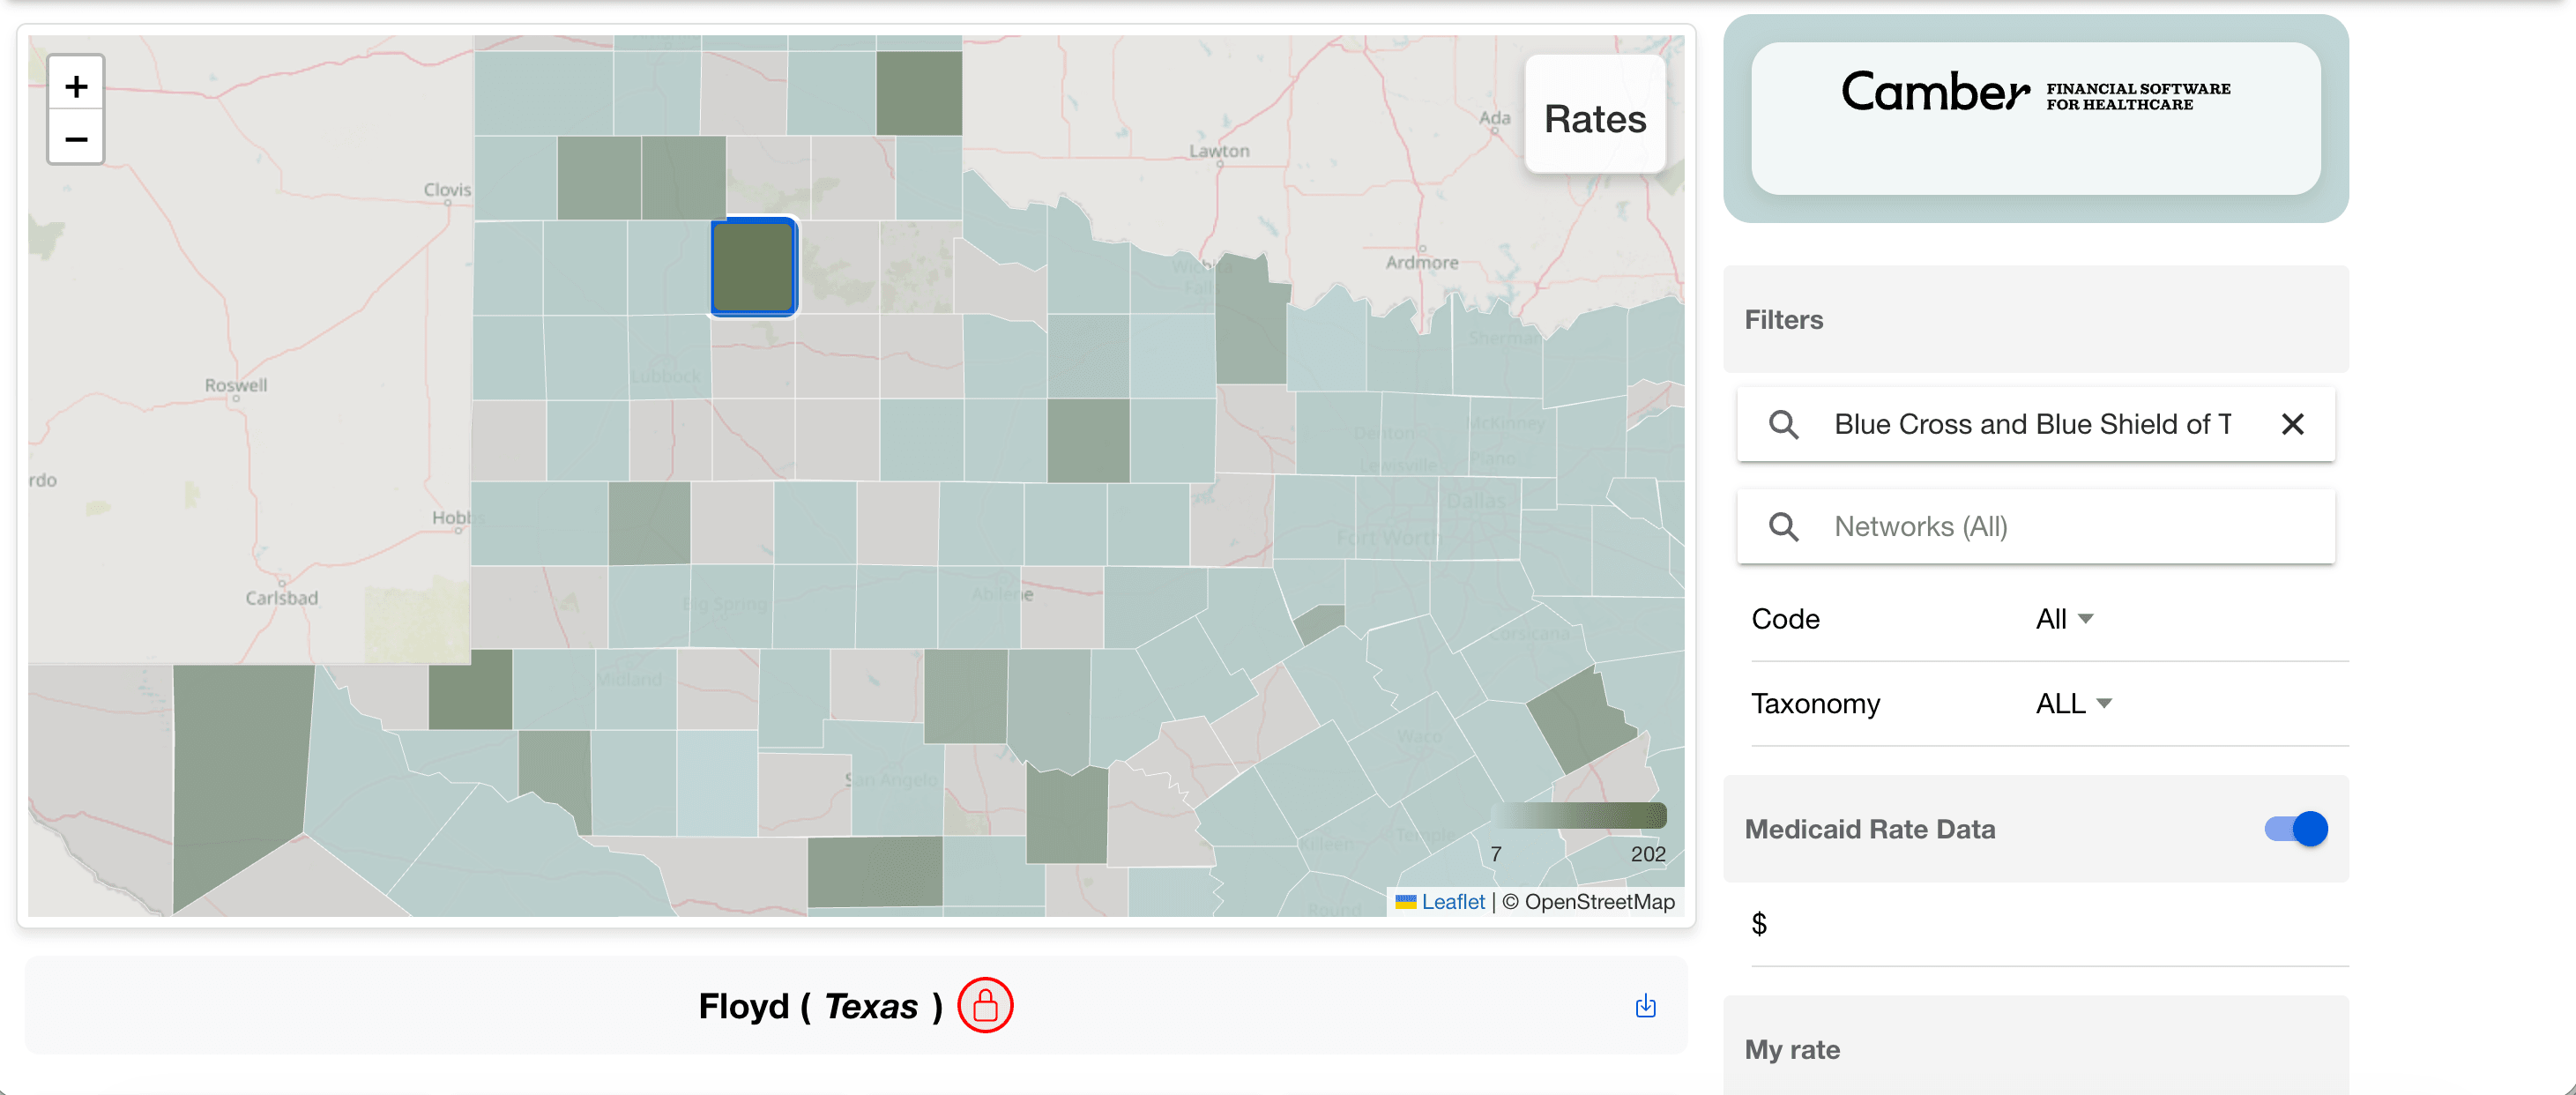
County-level heatmap of Texas with Floyd County highlighted showing a $201.90 rate
Hover over the county you want to view and press "L" to lock the rates, keeping the analysis focused on that county even if you zoom out or navigate away.
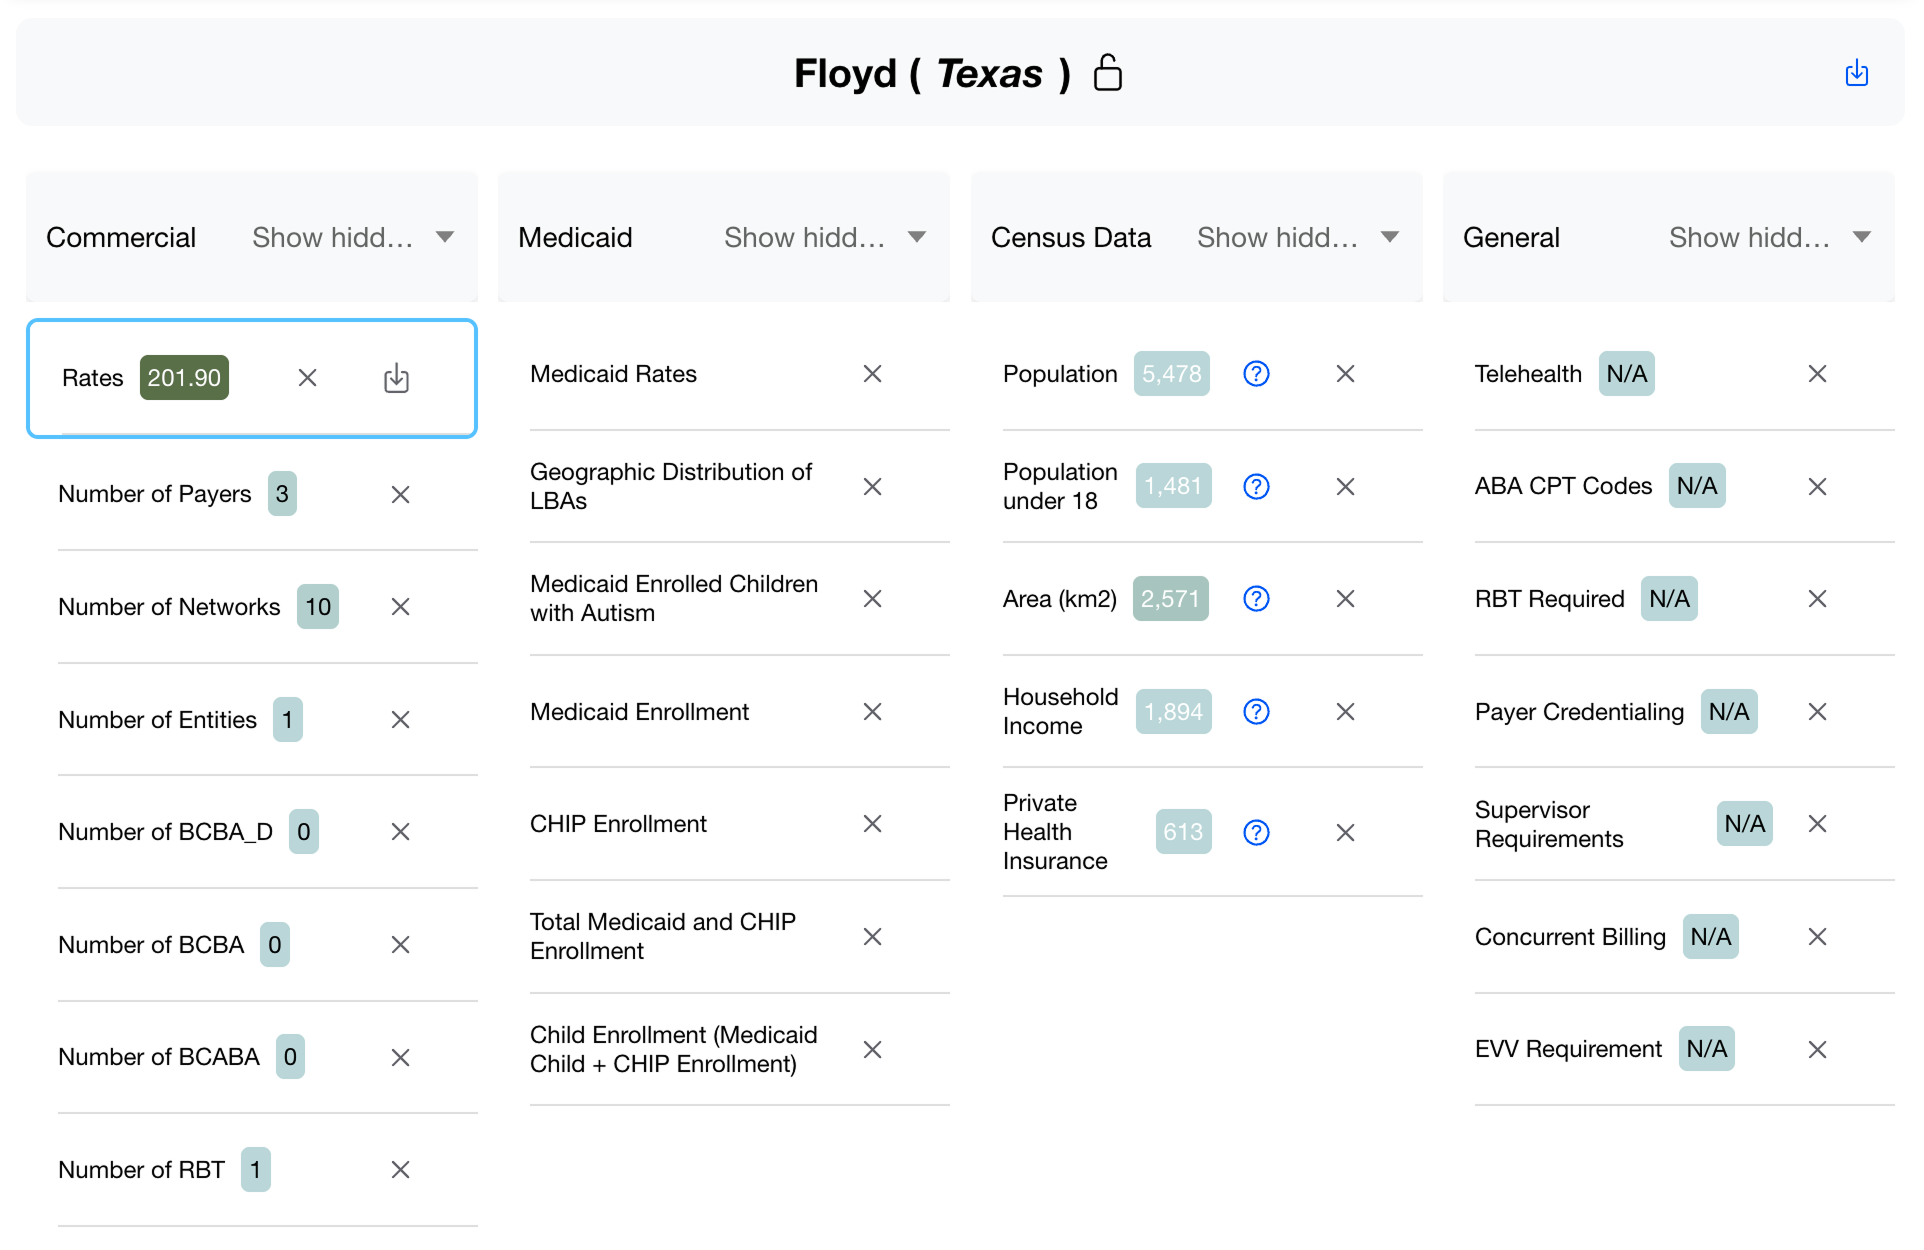
Floyd County, Texas data table with Commercial, Medicaid, Census Data, and General columns
Scrolling down, we can view additional details for Floyd County (like the number of BCBAs) that can help guide expansion decisions.
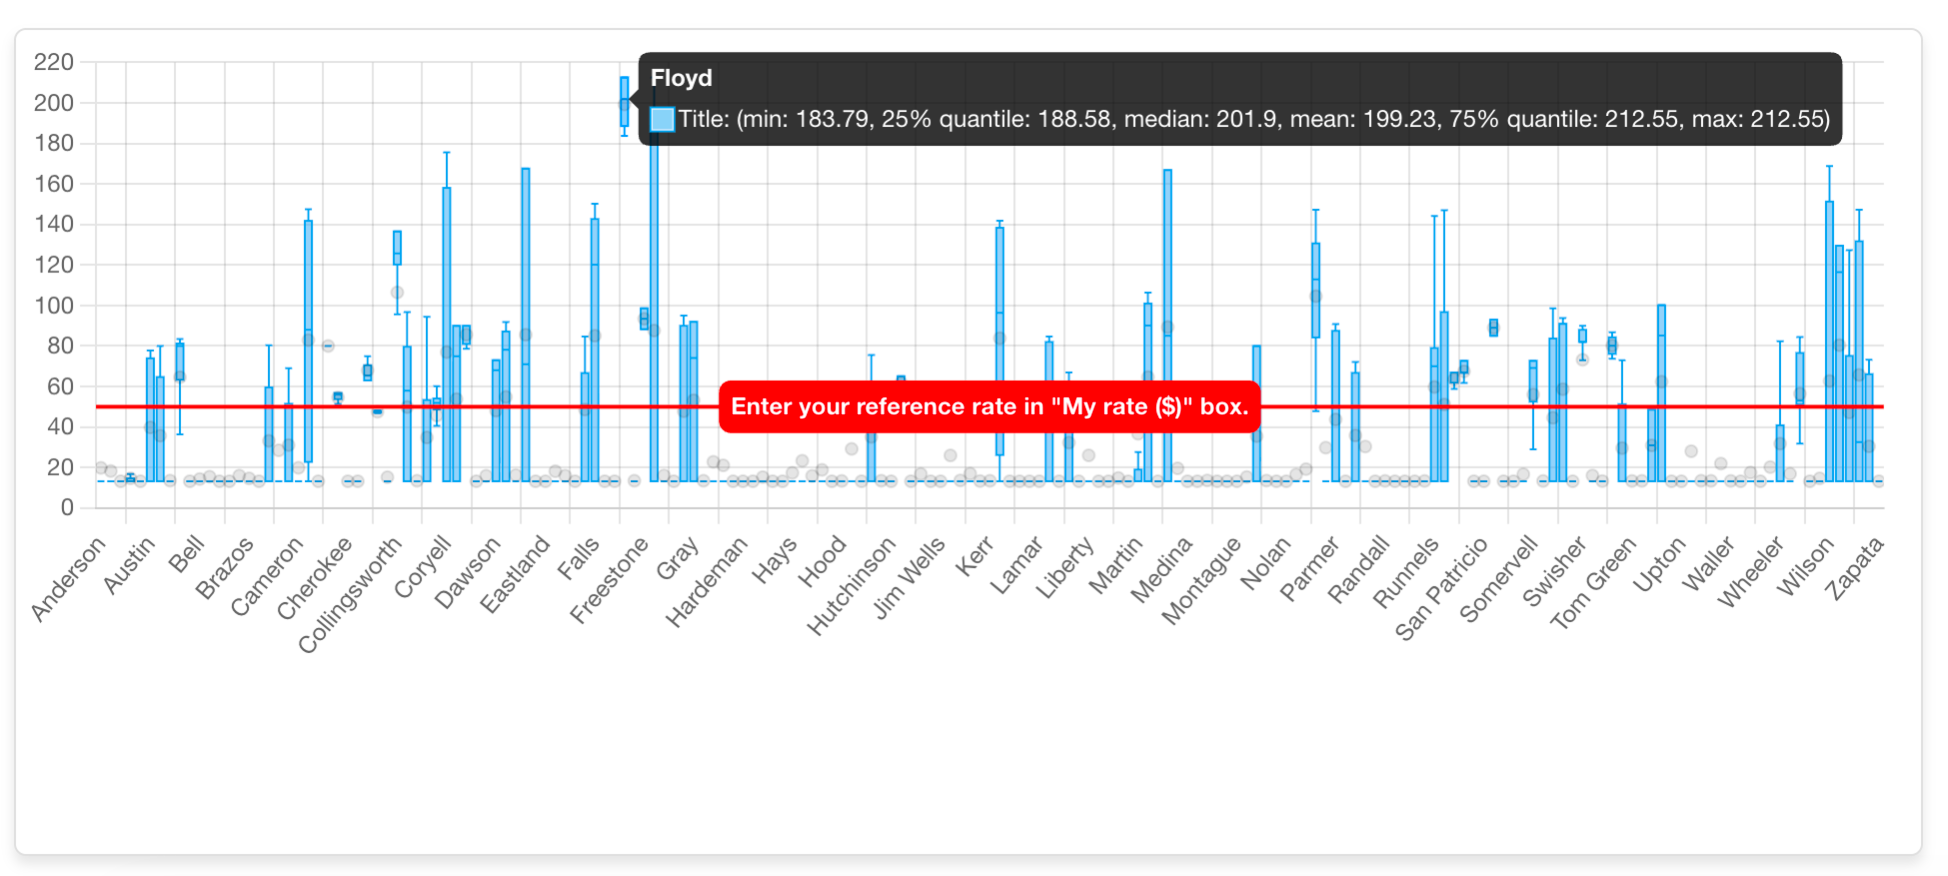
Quartile chart comparing Floyd County rates against all Texas counties with red reference line
We can see here that the data confirms that Floyd County's rates are significantly higher than those of other counties.
1 / 8

Camber's Payer Rate Data Tool

Filter by payer, county, and CPT code to compare reimbursement rates side by side. Pair that with BCBA and RBT staffing data and pediatric population figures to judge whether a market can actually support a new clinic.

Enter your email to receive a secure access code and start exploring immediately.

Get your access code
  • Interactive maps showing rate variation by state and county
  • Payer-specific benchmarking to guide network strategy
  • CPT-specific filtering down to the codes that drive your revenue
  • Quartile analysis so you know exactly where a market ranks